CHALLENGE:
- Siloed, limited data and models prevented ConocoPhilips from being able to develop confident subsurface pressure models
- Model confidence was low
- No visualization tools existed to compare results across different predictive techniques
SOLUTION:
- Integrate disparate data
- Develop a visualization tool
RESULTS:
- Enabled geoscience team to support real-time drilling operations
ConocoPhilips wanted to make pore pressure predictions with limited data sets
Logs from two wells and a limited set of 2D and 3D seismic were the only data available to model subsurface pressure. With this limited data set and available software, it was difficult for CoPEG to develop confident models, as well as visualize comparisons of the pore pressure derived from the different techniques. It was also believed combining all data and models could increase accuracy.
Classic pore pressure prediction techniques were applied, for example 3D seismic velocity-to-pore-pressure transforms calibrated to offset wells. However, the greenfield motivated applying advanced AI techniques to see if models that provided more confidence could be derived.
Use AI techniques to support real-time drilling operations
The first step was to solve the data integration and viewing problem, common to all operators. Once complete, data was integrated and available on a 1D log and 2D cross section viewer, and 3D cube view. For example, 1D well logs and 3D horizons were viewed overlaid on a 2D cross section.
Applying AI techniques, models were built that gave increased confidence in the pore pressure data. It was also important to develop local pore pressure models to support the real time data demands of drilling operations. Simplicity in data manipulation and presentation enabled the subsurface team to provide the support drilling operations demanded.
Map view of interpolated pressure predictions showing the challenge of diverse field conditions and limited well data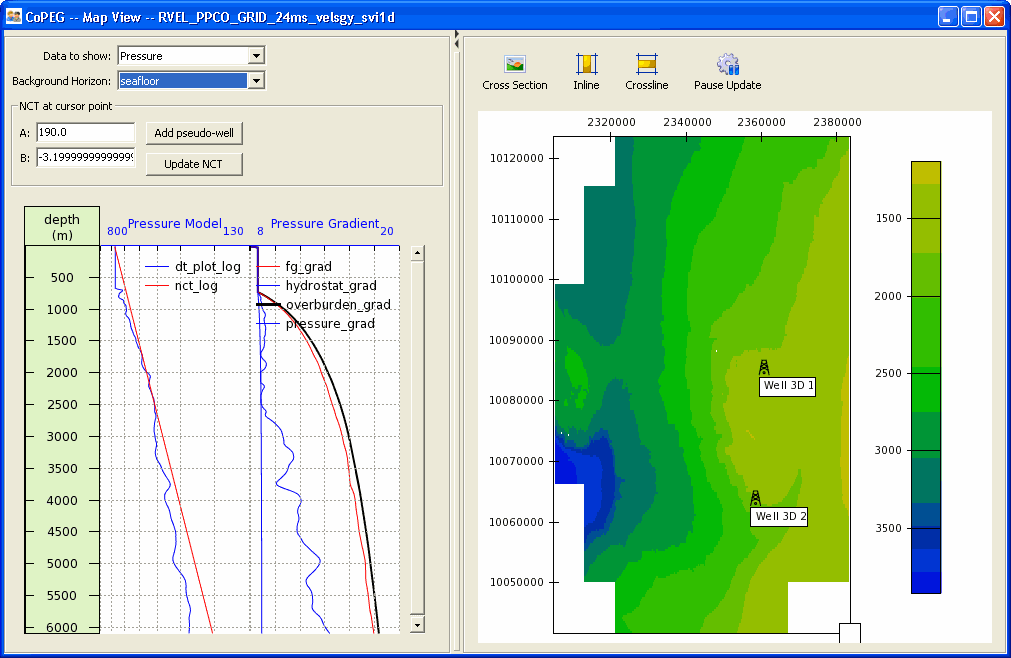
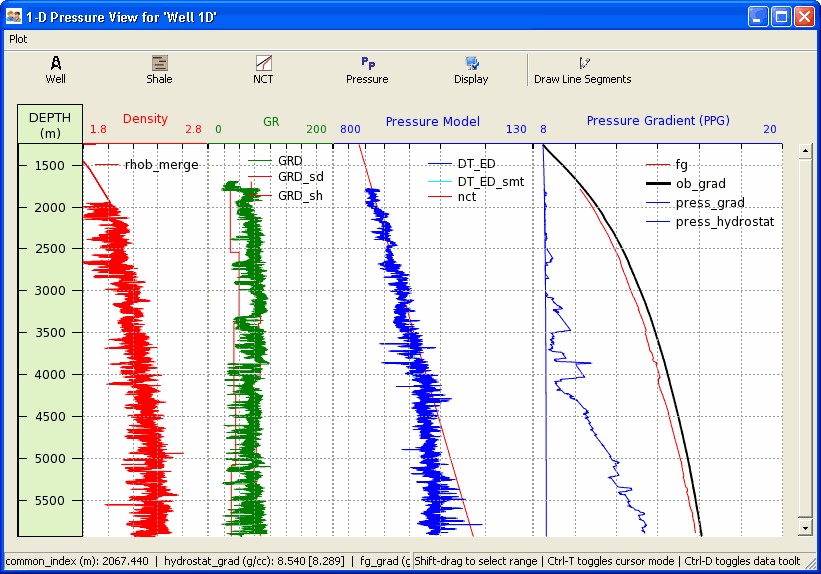
Depth curve of predicted pressure based on log data
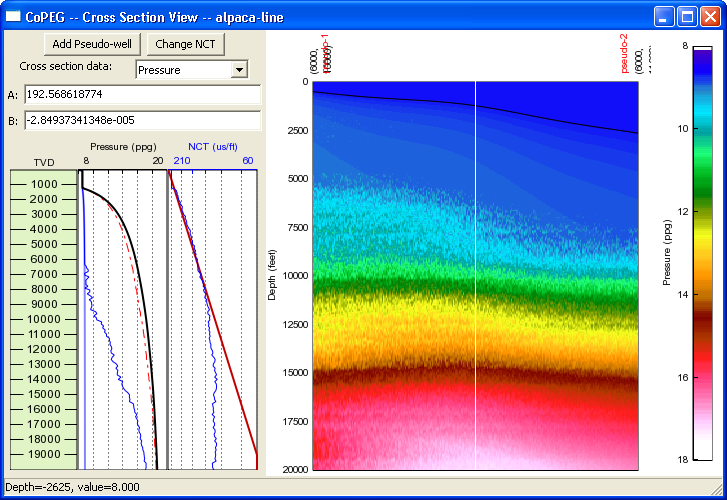
Cross-section view of seismic data converted using velocity model | Envisage block canvas