CHALLENGE:
- Assimilate gigapixel images using computational methods to provide a massive, searchable dataset of rock texture and color features
- Give petrophysicists the ability to quickly visualize and analyze hundreds of thin section images
SOLUTION:
- Create a data processing pipeline for reading raw image data directly from the microscope output
- Use textural measurements from core plugs to train machine learning models to predict rock and reservoir properties for the full core
RESULTS:
- Generation of a powerful tool that allows petrophysicists to analyze entire thin section specimens across an entire field quickly and reproducibly
- Objective comparison metrics of thin sections across wells and development of well to well correlations
- Facies relationship constraints in wells where no core was taken with data from other analyses
Use AI techniques to efficiently extract mineralogy and grain size statistics from thin sections
Thin sections provide the closest examination of in situ rock properties, essential for accurate reservoir characterization and reserves estimates. Standard analysis techniques such as point counting yield the types of constituent minerals and their shape characteristics, however this is a time consuming and labor intensive procedure. Typically only a small region of the entire thin section specimen can be characterized, and hundreds of specimens can be generated from a single well core.
Modern microscopes generate high resolution images of thin sections at multiple polarization angles. These gigapixel images provide a massive dataset of texture and color features that can be used to extract mineralogy and grain size statistics. The size of this data makes it impossible to assimilate manually.
The challenge is to create an AI-based assistant that gives petrophysicists the ability to quickly visualize and analyze hundreds of thin section images.
Create custom tools to visualize and label features in the thin section data
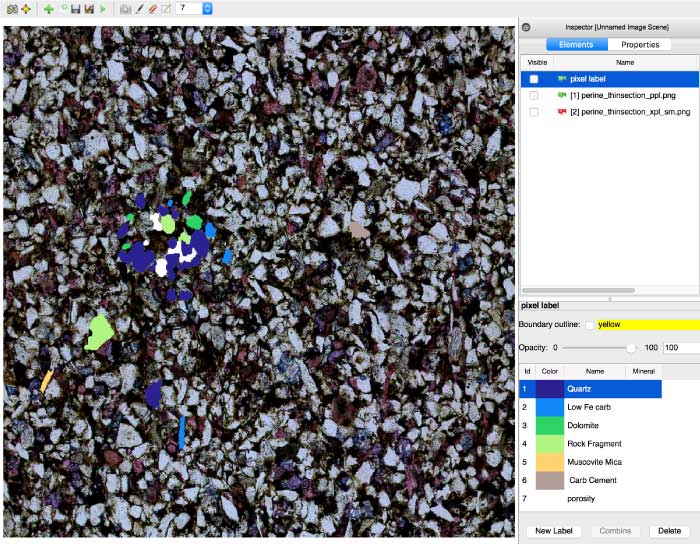
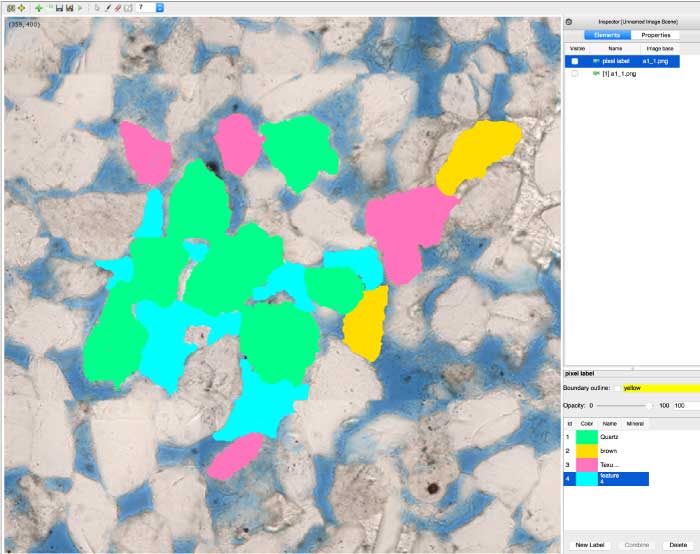
A data processing pipeline was created for reading raw image data directly from the microscope output. Each dataset consisted of a stack of high resolution images at multiple polarization angles. These were then used as features to distinguish between different minerals and grains. Each dataset was aligned and tiled for efficient viewing. A custom tool was created to provide an intuitive interface to visualize and navigate through the multidimensional image stacks. Controls were provided to allow a petrophysicist to easily label individual grains, providing an interpretation of the mineralogy. This interpretation was used to create a labeled dataset to train deep learning models for automated classification.
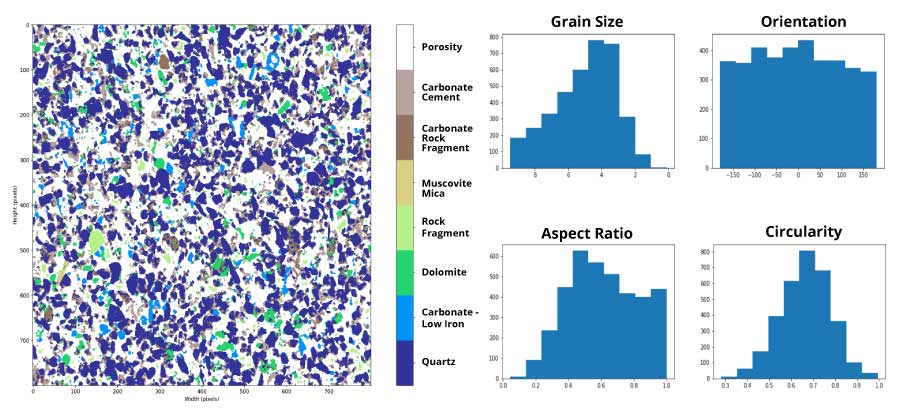
The trained models were then used to segment and identify individual grains and porosity. Various statistics of grain shape and mineralogy were extracted over the entire set of thin sections.
Quickly and accurately characterized specimens across the entire field to provided well-to-well correlations
The result was a tool that allowed petrophysicists to analyze entire thin section specimens across an entire field quickly and reproducibly. The analysis results enabled objective comparison of thin sections across wells, and development of well to well correlations. This provided additional data to constrain facies relationships in wells where no whole core was taken.
 [/lightbox]
The thin section classification tool provides the petrophysicist an intuitive interface to visualize and navigate through the multidimensional image stacks. The petrophysicist can then quickly interpret and label individual grains, providing an interpretation of the mineralogy. This interpretation is then used to create labeled dataset to train deep learning models for automated classification.
Entire thin sections can be analyzed for granulometry and mineralogy. The tool allows petrophysicists to analyze entire thin section specimens across an entire field quickly and reproducibly. Shown below are histograms of grain size, orientation, aspect ratio, and circularity.