CHALLENGE:
- CSEM techniques require extensive data cleaning and post-processing to make the most of available data
- The existing process was tedious, prone to error and data loss, and wasted time
SOLUTION:
- Developed a calibration tool for CSEM frequency-domain data using computational tools and strategies rather than the existing manual processes
RESULTS:
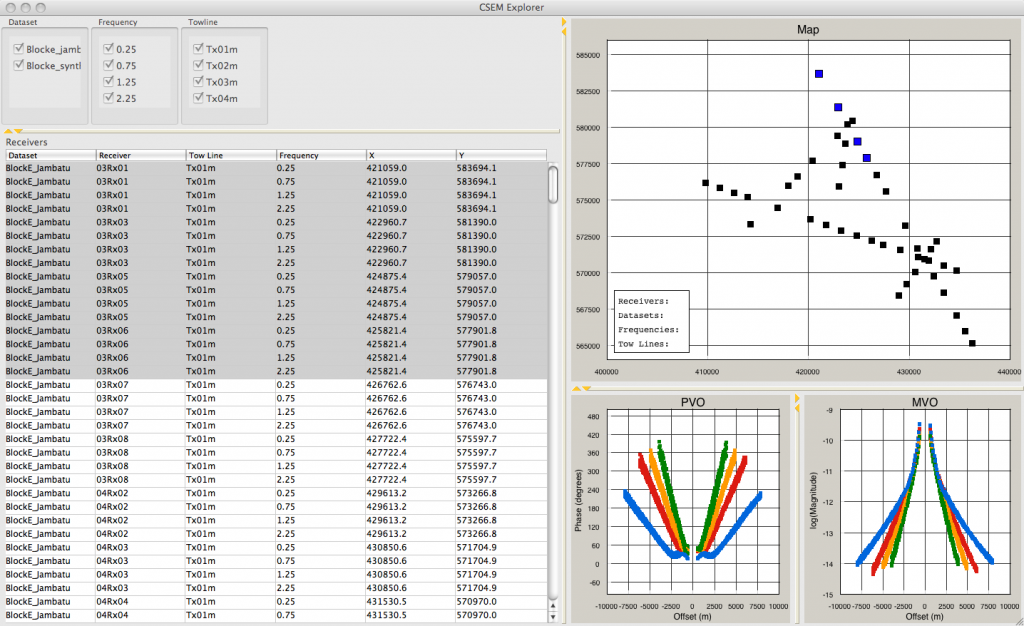
- The user can explore data sets through tables, maps, and graphs, and apply different calibrations to different subsets of data
- Once calibrated, the data can then be inverted to get an earth model
- Finally, the tool can then be used to compare the actual data with the synthetic data from the fitted earth model
Shell needed a way to effectively visualize a new scientific measurement
Controlled-Source Electromagnetic sounding (CSEM) is a new tool for marine oil exploration. Sensitive electric and magnetic field detectors are deployed to the seafloor over a prospect. A ship then tows a low-frequency electric source over the detectors. Variations in the electromagnetic properties of the rock below the detectors, specifically those due to the presence of oil, cause detectable changes in the magnitude and phase of the signal received by the detectors.
Because ship time is such a precious resource, extensive data cleaning and post-processing is required to make the most of the available data. Since CSEM is a new technique, geophysicists are still working out the best practices for analyzing the data. CSEM software must be lightweight and flexible to evolve with the field.
Develop a calibration tool that reduces the tedious and manual nature of dealing with CSEM data
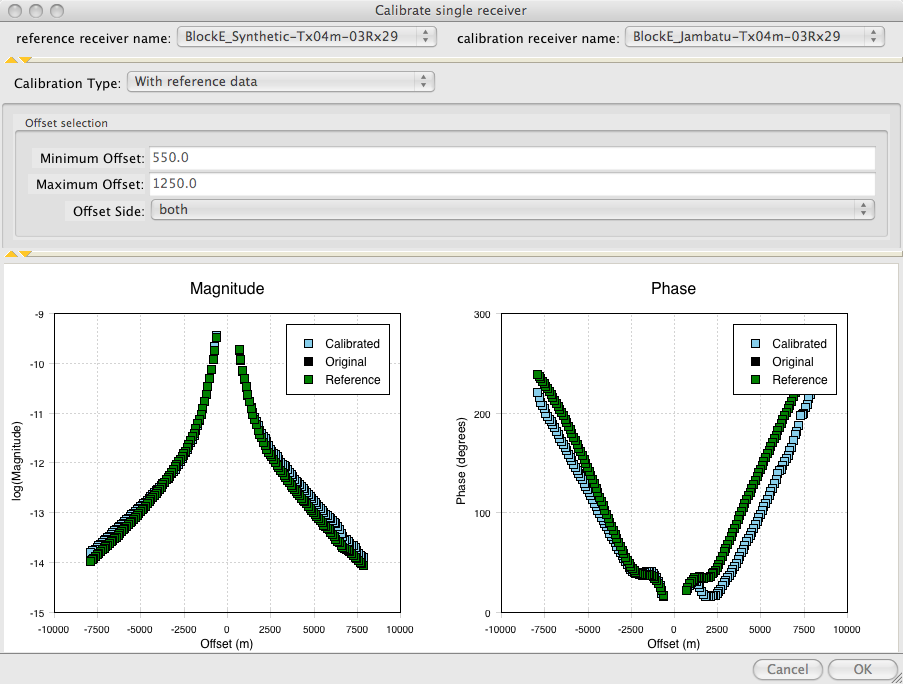
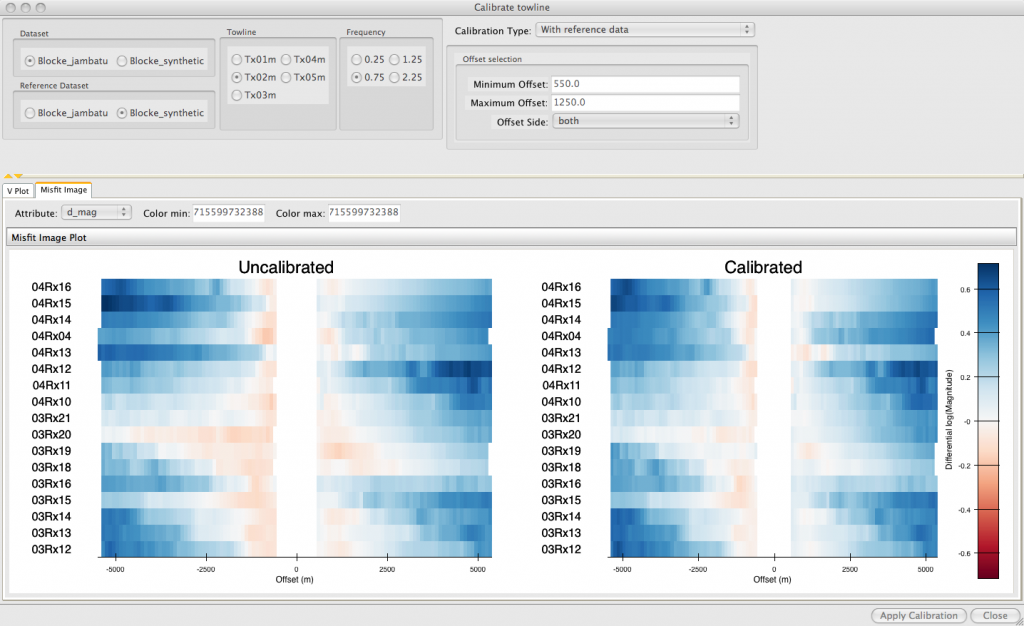
We wrote a calibration tool for CSEM frequency-domain data. There are several artifacts in the CSEM data that appear as bulk shifts in the magnitude and phase of the received signal. Algorithms for doing the calibration automatically from a putative earth model do exist; however, they are not robust and require significant handholding and human intervention in order to work well. Shell used to do this process through the manual manipulation of Excel spreadsheets and some Matlab scripts. The process was tedious, prone to error and data loss, and time-wasting.
Our tool lets the user explore their datasets through tables, maps, and graphs and apply different calibrations to different subsets of the data. Once calibrated, the data can be inverted to get an earth model. The tool can then be used to compare the actual data with the synthetic data from the fitted earth model.
We were able to work with the scientists at Shell to develop a calibration tool for CSEM frequency-domain data using computational tools and strategies rather than the existing manual processes.
Calibrating a single receiver
Map view
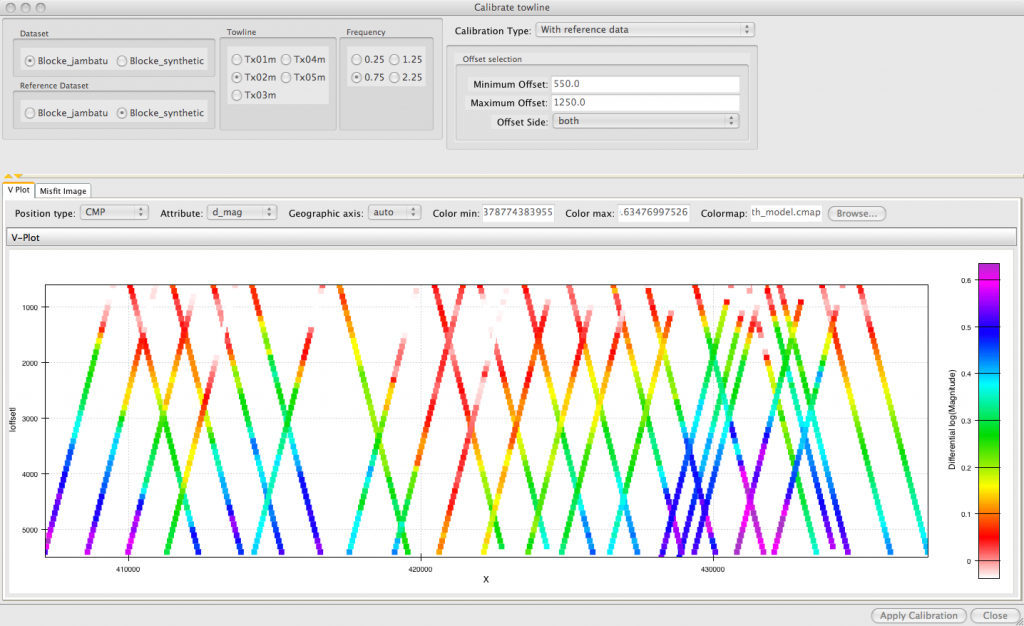
Calibrating a whole towline
V-plot